
How to monitor WhatsApp delivery and ban risk in AnyLinga
In AnyLinga for Kommo, you can check the WhatsApp message log to see original text, translations, delivery statuses, and errors. All of this is available under Monitoring.
WhatsApp numbers connected via QR code have a risk index. To assess the risk of a WhatsApp ban, check the number's metrics and incident history here. The index does not guarantee “WhatsApp campaigns without a ban.”
What you'll need
- Open the AnyLinga account you use with Kommo.
- To view events, select a channel that has already had activity.
- The risk index requires a WhatsApp number connected via QR code: how to connect WhatsApp via QR code.
- Check the time zone in settings: it is used for event times in the log.
Where to find monitoring
Monitoring is in the Workspace menu group. The Activity Log tab is always available.
The Risk Index tab appears if at least one WhatsApp number has ever been connected to the account via QR code. If only one tab is available, the tab bar is hidden.
1. Open monitoring
- In the Workspace menu, select Monitoring.
- Open Activity Log to check messages, translations, delivery, and billing.
- To check WhatsApp numbers connected via QR code, open Risk Index. The colored dot next to the tab shows the highest risk level among the numbers: green, yellow, or red.
How to use the activity log
2. Filter events
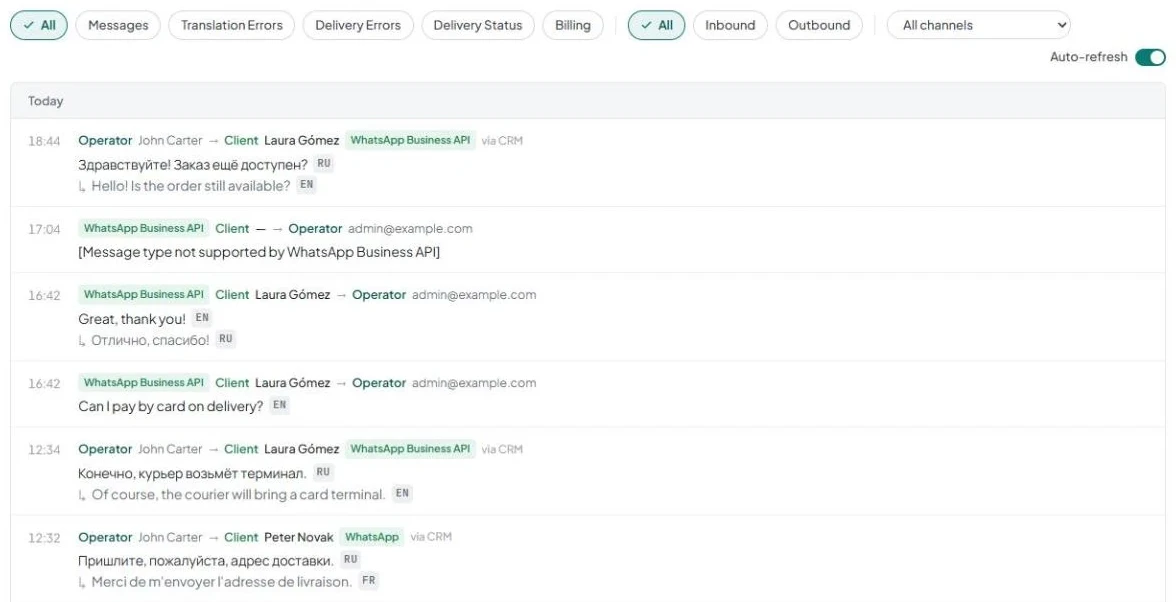
- Select a type: All, Messages, Translation Errors, Delivery Errors, Delivery Status, or Billing.
- Select a direction: All, Inbox, or Outbound.
- Select the channel you need from the All channels list. The list includes only channels with events. Channels with groups have a separate <channel> · Groups option.
- Enable Auto-refresh to refresh the log every 30 seconds. Your selection is saved in the browser.
3. Read a message entry
- Check the time, channel, and direction: client → operator or the reverse. The entry includes names and the via CRM / Mobile source.
- Look at the original text and its language label. The log displays up to 120 characters.
- Find the ↳ translation line with its language label. The Cached label indicates a cached translation.
- Events are grouped by day. Each page contains 50 entries. The … total · page … of … counter and Back / Next buttons help you navigate to other entries.
4. Review a translation error
- Select the Translation Errors filter.
- Check the result: Retry Success, Fallback Success, or All Failed.
- Check the languages in the “source → target” format, the provider, and the fallback provider.
- Click an entry to expand the error text. Learn more in the message translation article.
5. Check delivery and billing events
- Select Delivery Errors to see a plain-language reason for the error. The full text is available in a tooltip.
- Select Delivery Status and check for Sent, Delivered, or Read. Learn more in the delivery statuses article.
- Select Billing to find Subscription created, Subscription canceled, Subscription renewed, Payment succeeded, Payment failed, and Plan changed events.
How to read the risk index
The index is available only for WhatsApp numbers connected via QR code. It does not include WhatsApp Business API numbers. If there are no eligible connected numbers, No WhatsApp instances connected is displayed.
The scale runs from 0 to 100, with Healthy and Critical labels. Values of 0–25 are green, 26–50 are yellow, and 51 or higher are red. Data refreshes every 5 minutes.
6. Expand a number's card
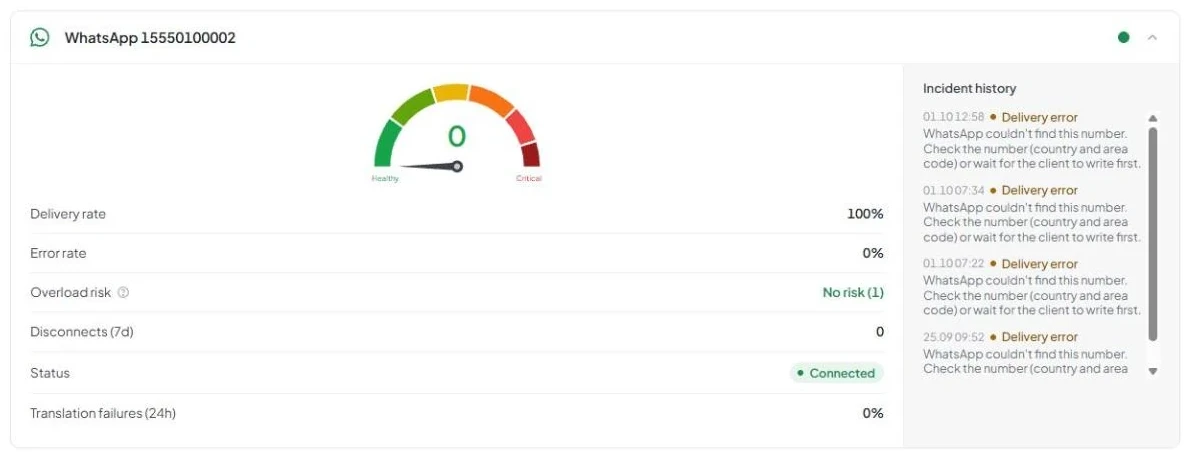
- On the Risk Index tab, find the WhatsApp card. The colored dot next to the number shows its risk level.
- Click the card to expand the scale, six metrics, and Incident history.
- Check the number in the center of the scale. If there is only one number, its card is expanded by default.
Which metrics make up the index
The scores from six metrics are added together. The total index is capped at 100 points. The translation failures metric applies to the entire account; the others apply to the individual number.
7. Check delivery rate, errors, and volume
- Delivery rate is the share of delivered and read messages over 24 hours. Above 95%: 0 points; 85–95%: 10; 70% to less than 85%: 20; 50% to less than 70%: 30; below 50%: 40. This metric is counted only if there are at least 10 outbound messages over 24 hours.
- Error rate is the share of errors over 24 hours. No errors: 0 points; less than 2%: 5; 2% to less than 5%: 10; 5% to less than 15%: 20; 15% or more: 25.
- Overload risk is the number of outbound messages over 24 hours. Fewer than 50: No risk, 0 points; 50–149: Low, 5; 150–299: Moderate, 10; 300–499: High, 15; 500 or more: Critical, 20.
8. Check connections and translation failures
- Disconnects (7d) is the total number of disconnections and QR code requests over 7 days. No events: 0 points; one: 5; 2–3: 10; 4–5: 15; more than five: 20.
- Status shows Connected or Disconnected. A disconnected number adds 15 points.
- Translation failures (24h) are counted across the entire account. No failures: 0 points; less than 5%: 5; 5% to less than 15%: 10; 15% or more: 15.
How to check incident history
Incident history is on the right side of the expanded card. It displays up to 10 events for the number.
9. Review the number's recent incidents
- Look for Disconnecting..., QR scan required, Reconnecting…, Delivery error, Retry succeeded, or Message volume spike events.
- Check the date and time in “DD.MM HH:MM” format. If error text is available, it appears below the event line.
- If there are no events, the section displays No incidents.
Get in touch
We reply during business hours.
Already using AnyLinga?
Describe your question and we'll reply on WhatsApp or by email.
New to AnyLinga?
Try it yourself, or we'll set it up for you when you pay for the first month.